
38108 C
Nutbush
- Typical value
- $67K
- Typical rent
- Data average $1,085 Highland Realty rent estimate $1,235 to $1,335
- 5-yr trend
- +10%
Home · Memphis ZIP guide
Investor guide
Our notes on 29 Memphis-area zip codes, so you can look at the market with more confidence.* Data pulled November 12, 2026. Every deal is still underwritten on its own numbers — conditions change block by block.
Birmingham ZIP guide is coming. This guide covers Memphis for now.
Grades
We grade each zip so you can compare markets with more confidence. Each zip gets a 0–100 composite score built only from five property and market factors. Each factor is scaled from the worst to the best zip in this guide, then weighted:
Score = 33% safety + 22% rent yield + 17% appreciation + 17% vacancy + 11% owner-occupancy. Schools are not part of the score.
Grades follow these score bands, with one judgment call. 38122 (Berclair) scores 52, which rounds onto the B line (51.9 before rounding). We grade it C based on our judgment of the market. The score shown is the formula result; it is marked with an asterisk (*) where it appears.
| Grade | Score | Meaning for a rental investor |
|---|---|---|
| A | 65+ | Strongest fundamentals: low crime, low vacancy, steady appreciation. Typical values are at the high end of the Memphis market, so cash flow is thin. |
| B | 52–64 | Solid, stable rental areas with moderate risk and light rehab. Typical values are generally higher than in the focus (buy-box) zips. |
| C | 42–51 | Workable cash-flow areas with mixed risk. Underwrite carefully and work street by street. |
| D | 32–41 | High risk: high vacancy and crime, falling or flat values, and heavier rehab. |
| F | under 32 | Weakest fundamentals for fix-and-rent (very high crime or vacancy, falling values, or a market that is mostly apartments or condos). |
Grade count (29 zips): A = 3 · B = 9 · C = 5 · D = 8 · F = 4
Voucher use and school proficiency appear in the data table for context only. Neither is used in the score or the grade, and no grade describes who lives in a zip.
Maps
All 29 zips in this guide, colored by investment grade. Buy-box zips have a bold outline and bold labels. The numbered hatched bands are our buy-and-hold sweet spot, described in the next section. Boundaries are U.S. Census Bureau TIGER/Line 2020 ZCTAs.
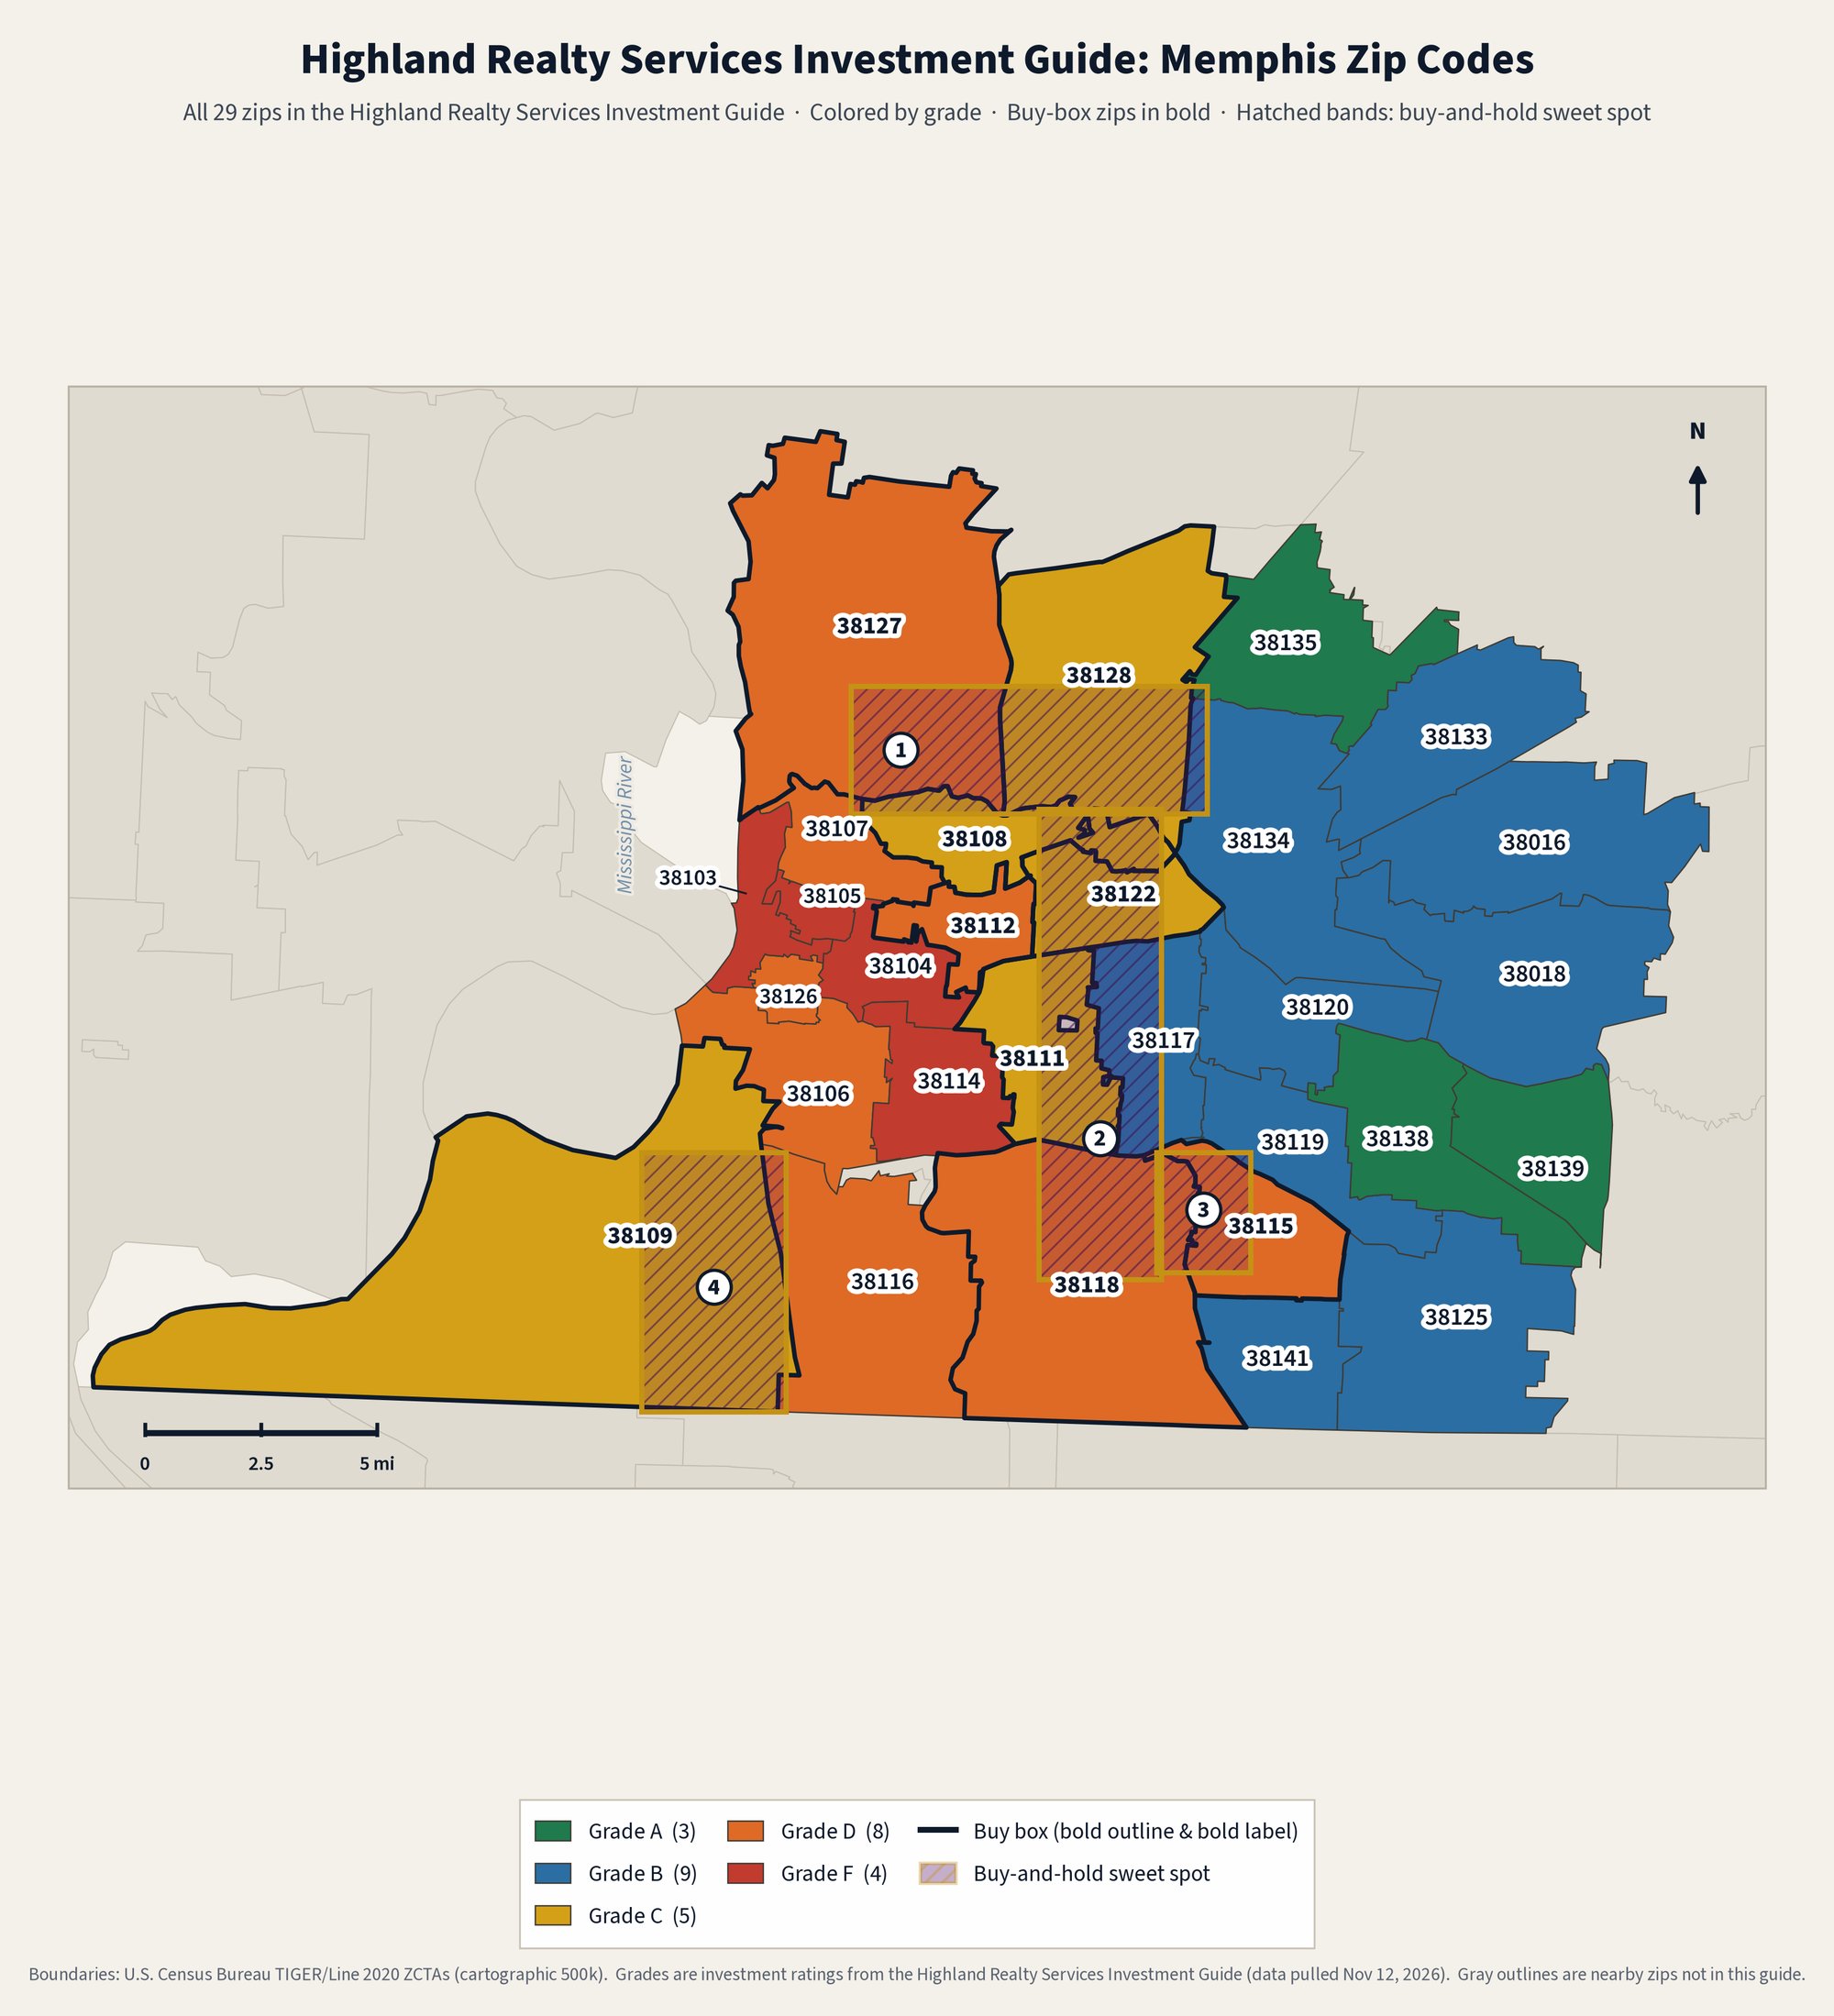
Figure 1. All 29 zips by investment grade. Buy-box zips are drawn with a bold outline. Numbered hatched bands are our buy-and-hold sweet spot. Gray outlines are nearby zips not in this guide.
Sweet spot
This is Highland Realty Services’ sweet spot for the buy-and-hold investor. The numbered, hatched bands on the map are approximate — they mark broad areas, not precise property or street lines.
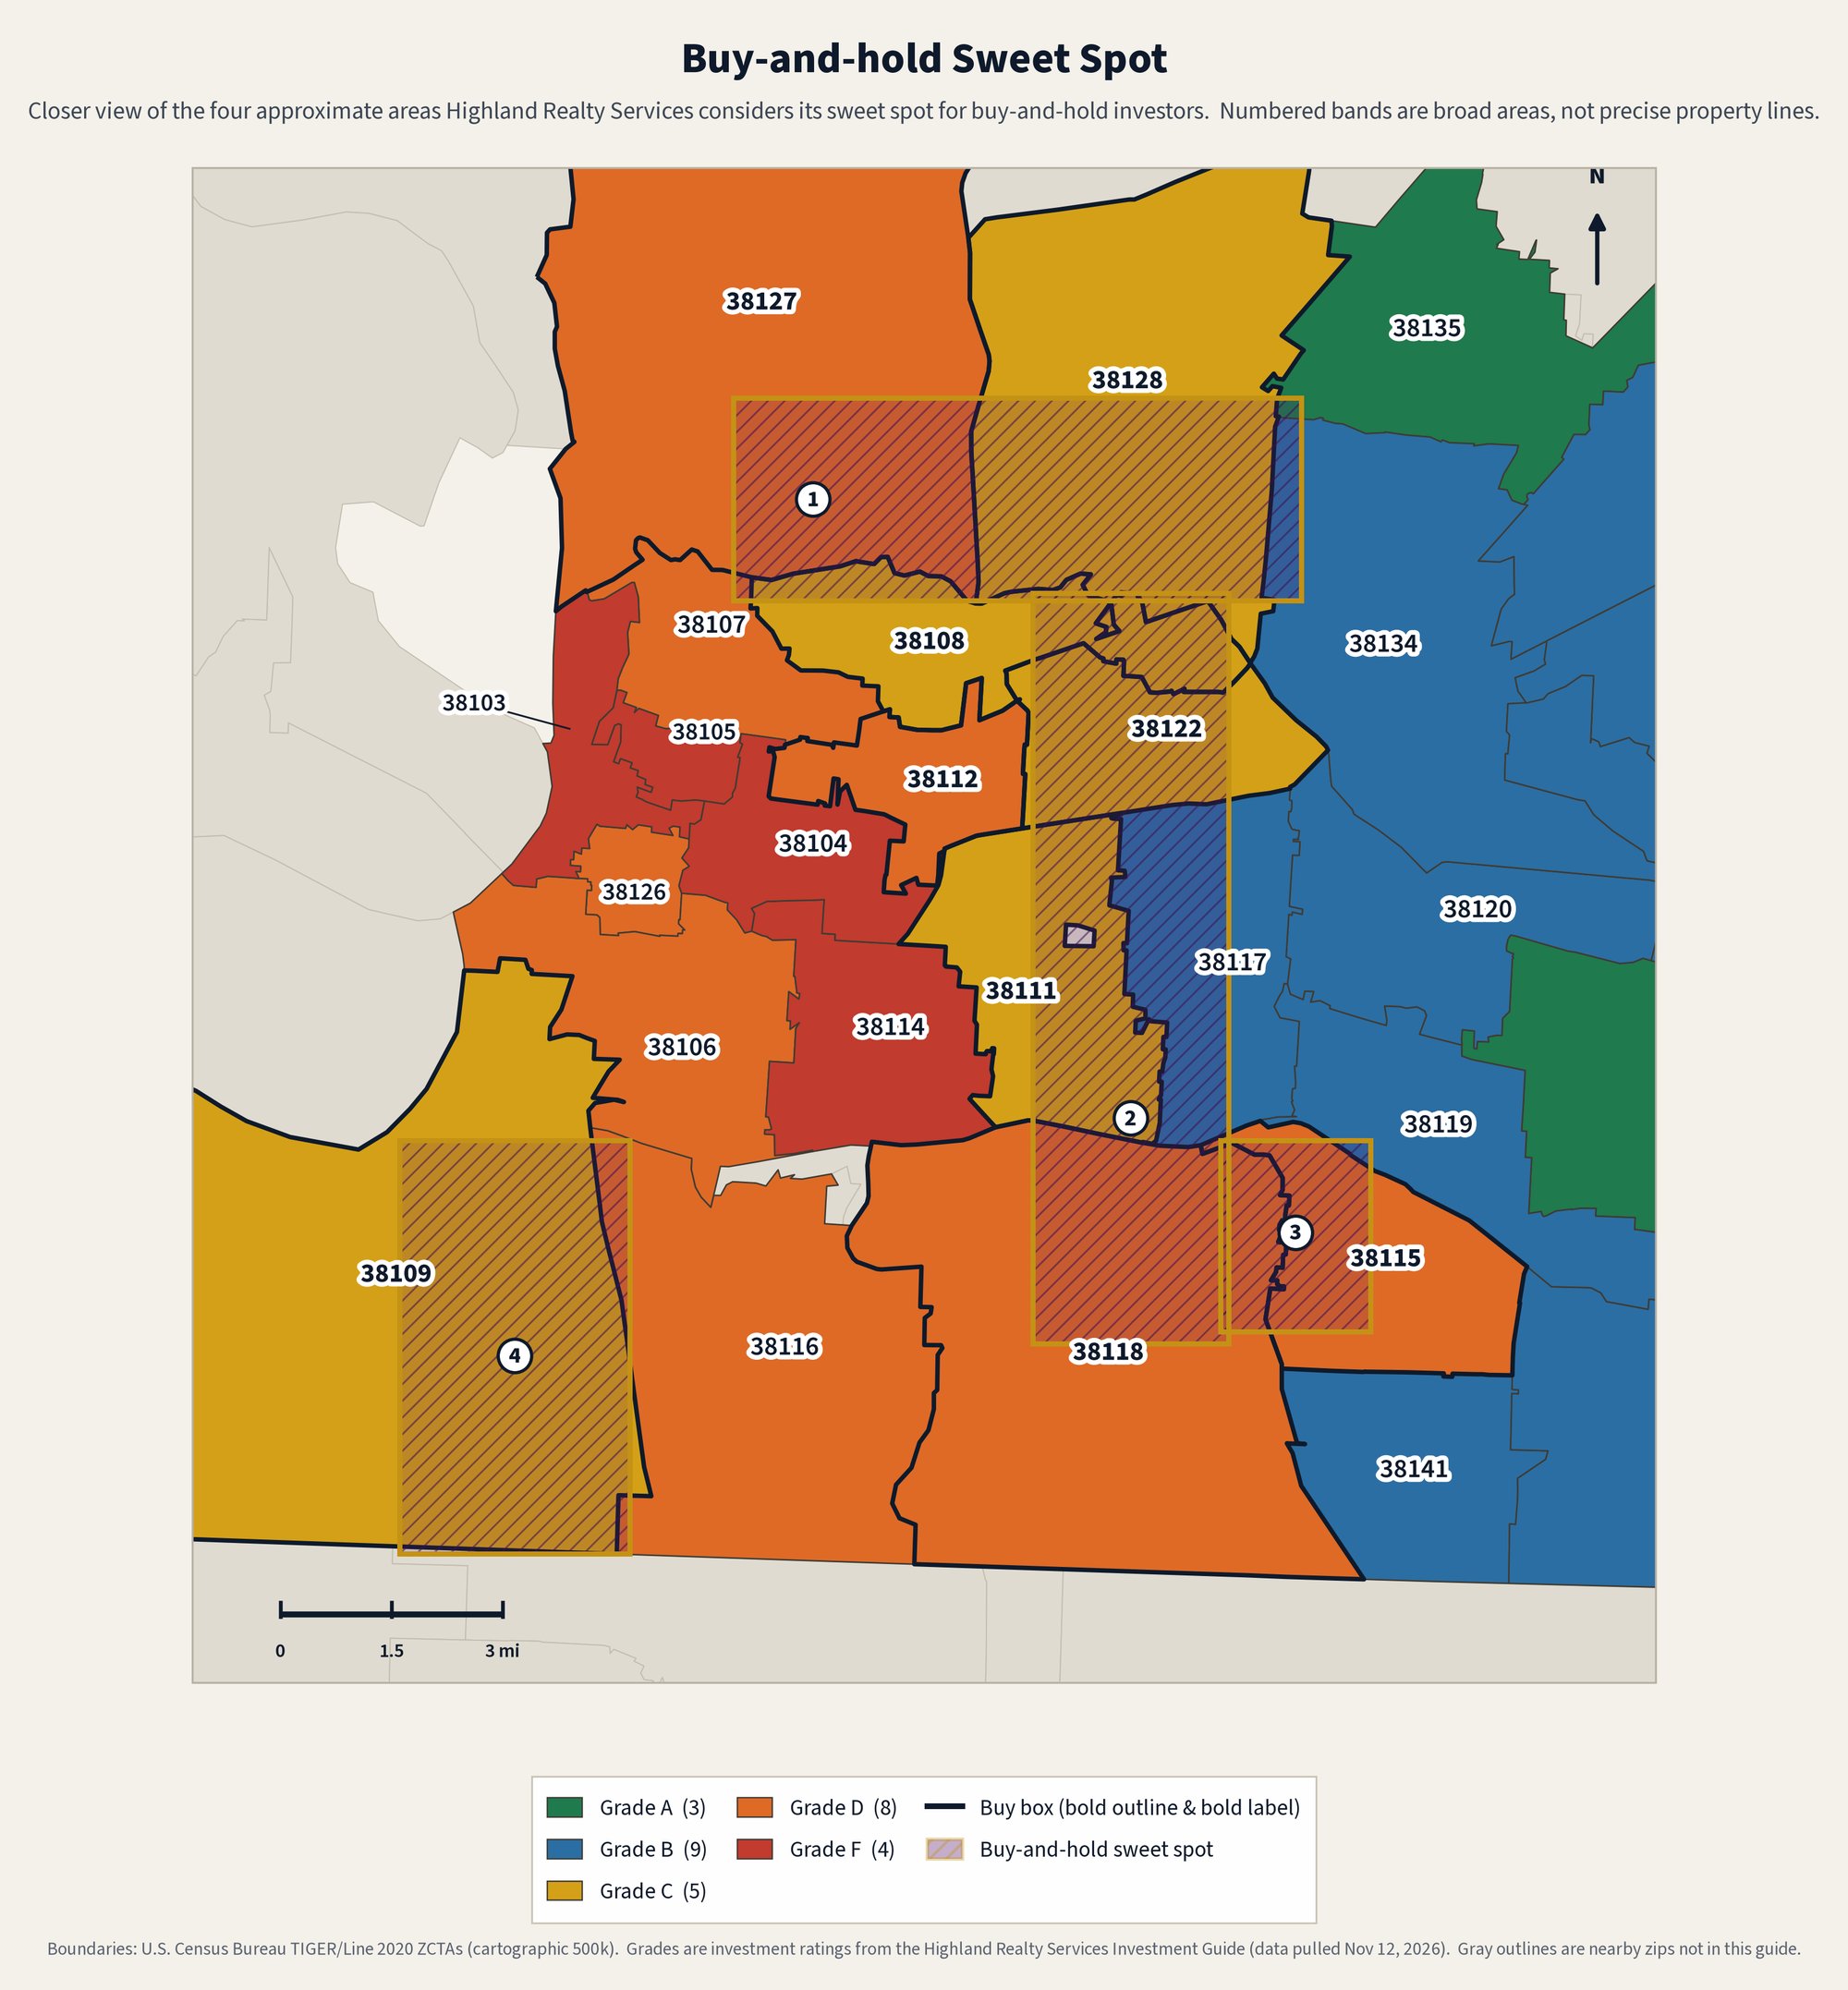
Figure 2. Closer view of the four buy-and-hold sweet-spot areas. The bands are broad areas, not precise property lines.
A band along the southern part of 38128 (Raleigh) that extends west into the eastern edge of 38127 (Frayser).
A north–south strip from the south edge of 38128, through 38122 (Berclair), along the shared border of 38111 (University District) and 38117 (East Memphis: White Station, Sea Isle), and into the northern part of 38118 (Parkway Village).
A smaller area on the western edge of 38115 (Hickory Hill north), next to 38118.
An area in the eastern part of 38109 (Westwood), near its border with 38116 (Whitehaven).
Zips in or along these areas: 38109, 38111, 38115, 38117, 38118, 38122, 38127, and 38128. Several of these are in the buy box; 38117 is not. As with every grade in this guide, conditions change block by block — underwrite the specific street.
Buy box
These nine zips are in the Highland Realty Services buy box — our current focus for acquisitions: 38108, 38109, 38111, 38112, 38115, 38118, 38122, 38127, and 38128. Typical value, rent, and the 5-year trend are Zillow (September 2026), shown as the data average. Based on actual Highland rent data, Highland Realty generally rents about $150 to $250 more than the average; a Highland Realty rent estimate sits next to each public-data figure. Figures are approximate.
A property in any other Memphis zip sits outside that focus, whatever its grade.
B and C areas
B and C zips on separate panels, at the same scale. Other zips from the guide are grayed for context. B areas are solid, stable rental areas, generally at higher typical values than the buy-box zips. C areas are workable cash-flow areas — underwrite street by street.
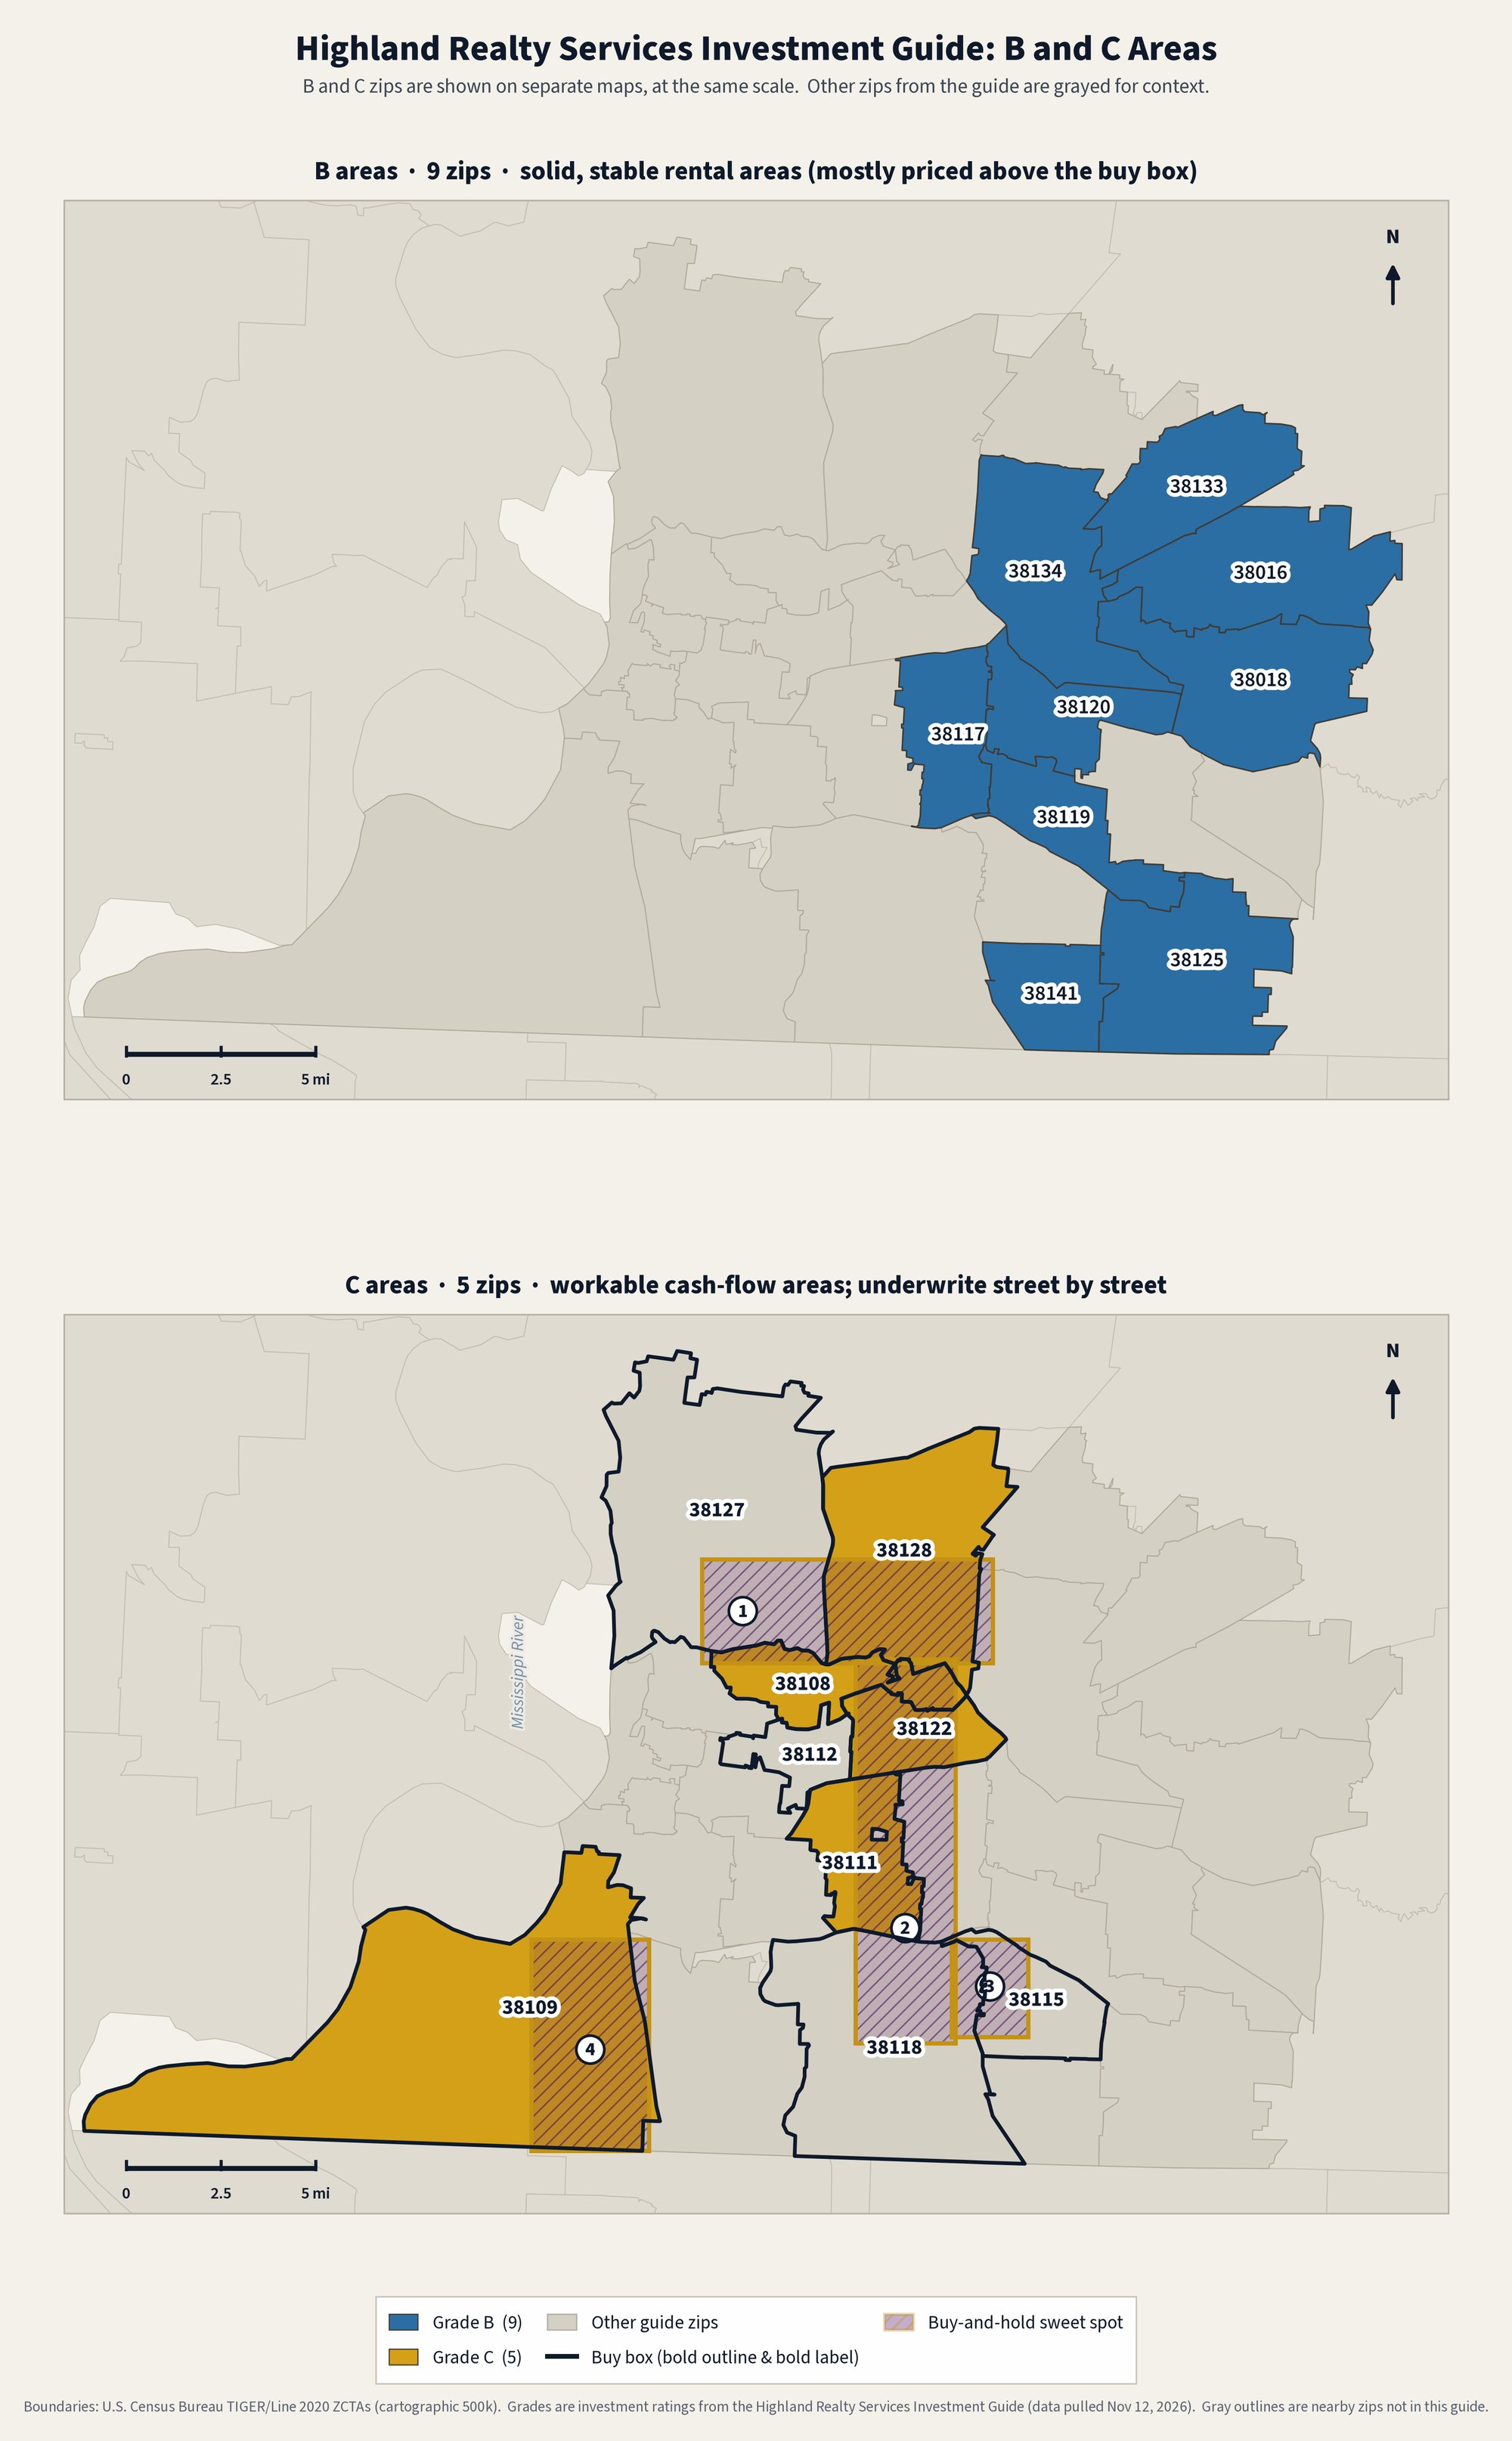
Figure 3. B areas (top) and C areas (bottom), at the same scale. Buy-box zips have a bold outline on both panels. Numbered hatched bands on the C panel are our buy-and-hold sweet spot.
One entry per zip. Figures come from the data table and our zip-by-zip notes; they are not new figures. Rent shows the data average and the Highland Realty rent estimate (data average plus $150 to $250, based on actual Highland rent data).
Bottom line: Newer stock; apartment-heavy pockets push vacancy up.
Bottom line: Newer homes with low vacancy and steady 5-year gains.
Bottom line: Established 1950s single-family neighborhoods, 76% owner-occupied. Crime is lower than most Memphis zips, but appreciation is slow: stable rental demand, thin cash flow.
Bottom line: 1970s homes plus condos and apartments (54% single-family). Crime is better than most of the city: stable and low-maintenance, but yields are thin.
Bottom line: Upper-end East Memphis, 72% owner-occupied, with one of the lower reported crime rates in the guide (72 per 1,000). Gross yield is only ~4%: a quality, appreciation zip, not a cash-flow zip.
Bottom line: Newer suburban stock; crime and schools both grade C−, better than most Memphis zips. Most homes are priced above the buy box.
Bottom line: 1990s suburban single-family with reliable rental demand; B+ crime and schools. Priced above the buy box.
Bottom line: The best non-redevelopment 5-year trend in the guide, and values are still up year over year.
Bottom line: 85% single-family. Crime grades F nationally, but the rate is well below most Memphis zips.
Bottom line: 1950s single-family (78%) at a low price: strong paper yield, but high vacancy and high crime. Heavy-rehab inventory is common.
Bottom line: Large, 87% single-family market, majority owner-occupied (56%): a core cash-flow zip.
Bottom line: Big, mixed zip (~42K residents) of 1950s homes around the University of Memphis. Values are flat; crime varies sharply by block (sub-areas grade B− to F).
Bottom line: 1950s single-family (77%). Vacancy is low for this price band.
Bottom line: 1970s homes (63% single-family). The best 5-year value trend among the buy-box zips.
Zip by zip
Filter by grade or buy box, or search by zip or neighborhood. 38016 and 38018 (Cordova) are not 381xx zips, but they lie largely inside the city of Memphis and are included for completeness.
Downtown, South Main, Harbor Town / Mud Island, South Bluffs
Condo- and apartment-heavy core (only ~19% single-family); typical value ~$319K vs. ~$1,540 rent (Highland Realty rent estimate $1,688 to $1,788), so rentals rarely cash-flow, and values are down ~5% YoY and ~2% over 5 years. Crime per resident is inflated by visitor and commercial activity; this is not a single-family rental market.
Midtown: Cooper-Young, Central Gardens, Overton Square area, Annesdale, Medical District edge
Oldest stock in the guide (median built 1949), with historic homes and small multifamily; typical value ~$249K vs. ~$1,265 rent (Highland Realty rent estimate $1,415 to $1,515). Values are down ~5% YoY and ~7% over 5 years; rental demand is strong, but the numbers fit flips and retail resale better than buy-and-hold.
Medical District, Uptown, the Pinch, north Downtown edge
Small zip (~5.5K residents), mostly apartments and infill, ~14% owner-occupied and ~24% vacant. Values are up ~27% over 5 years from a low base, but a very high reported crime rate makes it a specialist market.
South Memphis, Soulsville, Riverside, Longview Heights, Glenview (part)
1950s small single-family homes at the lowest values in the guide (~$55K typical, ~$900 rent (Highland Realty rent estimate $1,058 to $1,158)). Paper yields are high, but vacancy is ~23%, values fell ~6% last year, and heavy rehab is common.
North Memphis: Klondike, Smokey City, New Chicago, Hyde Park, west Vollintine-Evergreen
Pre-1960 housing (median 1954); typical value ~$104K, ~17% vacancy. Values are up ~7% over 5 years but down ~4% last year. Expect heavy rehab and turnover risk.
Nutbush, Hollywood, Chickasaw Heights, north Highland Heights
1950s single-family (78% SF) at ~$67K typical value with ~$1,085 Zillow rent (Highland Realty rent estimate $1,235 to $1,335): strong paper yield, but ~16% vacancy and high crime. Values are down ~4% YoY and up ~10% over 5 years; heavy-rehab inventory is common.
Westwood, Whitehaven (west), Boxtown / Westhaven, Indian Hills
Large, 87% single-family market of 1960s-era homes (~$88K typical, ~$1,150 rent (Highland Realty rent estimate $1,301 to $1,401)), majority owner-occupied (56%): a core cash-flow zip. Values are down ~7% YoY (+4% over 5 years); moderate rehab is typical.
University District / U of M, Normal Station, Sherwood Forest, Chickasaw Gardens area, south Highland Heights
Big, mixed zip (~42K residents) of 1950s homes around the University of Memphis; typical value ~$131K, rent ~$1,280 (Highland Realty rent estimate $1,430 to $1,530), ~11% vacancy. Values are flat over 5 years (+2%); crime varies sharply by block (sub-areas grade B- to F); moderate rehab on mid-century stock.
Vollintine-Evergreen, Evergreen, Binghampton, Hein Park / Overton Park area, Crosstown (east)
Old stock (median built 1950), ranging from historic Evergreen homes to distressed Binghampton houses, so medians disagree (Zillow ~$120K vs. Census ~$252K). Zillow shows values down ~8% YoY and ~4% over 5 years. Work it street by street and budget for older systems.
Orange Mound, Castalia Heights, Glenview, Cherokee
1950s small homes at ~$71K typical value; ~23% vacancy and among the highest crime rates. Values are down ~7% YoY and ~5% over 5 years; heavy rehab and high holding risk.
Hickory Hill (north), Fox Meadows, Ridgeway / Mt. Moriah corridor
Apartment-heavy (32% single-family, 23% owner-occupied) 1980s-era stock; typical value ~$161K, rent ~$1,030 (Highland Realty rent estimate $1,179 to $1,279). Values are up ~11% over 5 years, but ~15% vacancy and high crime; the single-family streets are the opportunity.
Whitehaven (east), Graceland area, airport south
1960s housing, ~$151K typical value, ~$930 rent (Highland Realty rent estimate $1,078 to $1,178) (apartment-weighted), ~16% vacancy. Values are up ~9% over 5 years; single-family pockets are steadier than the apartment corridors.
East Memphis: White Station, Sea Isle, Red Acres, Colonial Acres, Poplar–Perkins
Established 1950s single-family neighborhoods, 76% owner-occupied, ~$264K typical, ~$1,470 rent (Highland Realty rent estimate $1,616 to $1,716), ~5% vacancy. Crime is lower than in most Memphis zips (C+) but appreciation is slow (+4% over 5 years): stable rental demand, thin cash flow, light-to-moderate updates.
Parkway Village, Oakhaven, Knight Arnold / Getwell, Airways south
1970s-era homes, ~$120K typical, ~$1,180 rent (Highland Realty rent estimate $1,328 to $1,428): a good rent-to-price ratio. But vacancy is ~19% (apartment-heavy pockets) and robbery and assault rates are high. Values are up ~9% over 5 years; moderate rehab is typical.
Kirby, Balmoral, Ridgeway, Poplar–Kirby, River Oaks (part)
1970s homes plus condos and apartments (54% SF); ~$288K typical, ~$1,470 rent (Highland Realty rent estimate $1,622 to $1,722), ~6% vacancy. Crime grades C (better than most of the city) and values are up ~8% over 5 years: stable and low-maintenance, but yields are thin.
River Oaks, Walnut Grove, Shady Grove, East Memphis Poplar corridor
Upper-end East Memphis (~$422K typical), 72% owner-occupied, with one of the lower reported crime rates in the guide (72 per 1,000; B+). Gross yield is only ~4%: a quality, appreciation zip, not a cash-flow zip.
Berclair, Highland Heights (east), Grahamwood, Summer Ave corridor
1950s single-family (77% SF), ~$121K typical, ~$1,120 rent (Highland Realty rent estimate $1,269 to $1,369), ~7% vacancy (low for this price band). Values are up ~13% over 5 years though down ~4% last year; moderate rehab on mid-century homes.
Hickory Hill (south), Southwind, Riverdale, Windyke
Newer suburban stock (median built 1996), ~$276K typical, ~$1,520 rent (Highland Realty rent estimate $1,666 to $1,766), ~5% vacancy; crime and schools both grade C- (better than most Memphis zips). Values are up ~14% over 5 years; light rehab; most homes are priced above the buy box.
South City (former Foote Homes site), Vance Ave, LeMoyne-Owen area, south Downtown edge
Small zip (~6K residents), mostly apartments and public-housing redevelopment, 12% owner-occupied, ~$72K typical value. It has the highest reported crime rate in the guide; values are up ~34% over 5 years from redevelopment, but there are few single-family rentals.
Frayser, Rugby Hills, Shelby Forest area (part)
Large 1960s single-family zip (77% SF), ~$87K typical with ~$1,085 rent (Highland Realty rent estimate $1,235 to $1,335) (strong paper yield), but ~18% vacancy and values down ~6% YoY (+1% over 5 years). Moderate-to-heavy rehab is common; underwrite street by street.
Raleigh, Raleigh Springs / Austin Peay corridor, Coleman Rd area
1970s homes (63% SF), ~$143K typical, ~$1,200 rent (Highland Realty rent estimate $1,348 to $1,448). Values are up ~15% over 5 years (down ~2.5% YoY), the best 5-year trend among the buy-box zips; ~12% vacancy, moderate rehab.
Bartlett (south), Wolfchase area (Memphis/Bartlett addresses)
1990s suburban single-family, ~$271K typical, ~$1,650 rent (Highland Realty rent estimate $1,798 to $1,898), ~4% vacancy, B+ crime and schools. Values are up ~15% over 5 years; light rehab and reliable rental demand; priced above the buy box.
Raleigh (east), Bartlett (south), Elmore Park, Shelby Oaks
1979-median homes, ~$223K typical, ~$1,200 rent (Highland Realty rent estimate $1,356 to $1,456), ~5% vacancy, C- crime. Values are up ~18% over 5 years (the best non-redevelopment trend in the guide) and +1% YoY; light-to-moderate rehab.
Bartlett (north), Ellendale, Raleigh–LaGrange
1990s single-family (92% SF), ~$295K typical, ~$1,800 rent (Highland Realty rent estimate $1,949 to $2,049), ~2% vacancy, A- crime, B schools, values up ~16% over 5 years. Top-tier stability with light rehab, but well above buy-box prices.
Germantown (west / central): separate city with its own police and codes
Premium suburb: ~$429K typical, ~$2,260 rent (Highland Realty rent estimate $2,409 to $2,509), ~4% vacancy, A crime and A schools, values up ~12% over 5 years. Appreciation and rental demand are strong; cash flow is thin.
Germantown (east), Forest Hill / Shelby Farms south edge
Highest values in the guide (~$585K), 97% owner-occupied, A crime, A+ schools, very few rentals (rent figure is Census, approximate: data average $2,697 (Census), Highland Realty rent estimate $2,847 to $2,947). An appreciation-only market.
Hickory Hill (south), Ridgeway–Hacks Cross, Shelby Drive area
1985-median homes, 85% single-family, ~$188K typical, ~$1,570 rent (Highland Realty rent estimate $1,720 to $1,820), ~3% vacancy, values up ~14% over 5 years. Crime grades F nationally but the rate (82 per 1,000) is well below most Memphis zips; light-to-moderate rehab.
Cordova (north): Germantown Pkwy / Wolfchase
Newer stock (1998 median), ~$290K typical, ~$1,500 rent (Highland Realty rent estimate $1,645 to $1,745), B- crime; ~8% vacancy (apartment-heavy pockets). Values are up ~10% over 5 years; light rehab.
Cordova (south), Shelby Farms east
1997-median homes, ~$287K typical, ~$1,660 rent (Highland Realty rent estimate $1,808 to $1,908), ~5% vacancy, B- crime. Values are up ~10% over 5 years; light rehab.
No zips match that filter. Clear search or choose All grades.
Data
Click a column header to sort. Typical value, rent, and trends are Zillow (September 2026), shown as the data average. Based on actual Highland rent data, Highland Realty generally rents about $150 to $250 more than the average; a Highland Realty rent estimate (data average +$150 to +$250) sits next to each public-data rent. Census figures are ACS 2020–2024 5-year estimates. All figures are approximate. Open a zip to jump to our notes.
Swipe the table to see all columns.
| Zip | Score | Grade | Area | Buy box | Typical value | Typical rent | 5-yr trend | Our notes |
|---|---|---|---|---|---|---|---|---|
| 38103 | 24 | F | Downtown, South Main, Harbor Town / Mud Island, South Bluffs | — | $319K | Data average $1,538 Highland Realty rent estimate $1,688 to $1,788 | −1.7% | Condo- and apartment-heavy core (only ~19% single-family); typical value ~$319K vs. ~$1,540 rent (Highland Realty rent estimate $1,688 to $1,788), so rentals rarely cash-flow, and values are down ~5% YoY and ~2% over 5 years. Crime per resident is inflated by visitor and commercial activity; this is not a single-family rental market. |
| 38104 | 26 | F | Midtown: Cooper-Young, Central Gardens, Overton Square area, Annesdale, Medical District edge | — | $249K | Data average $1,265 Highland Realty rent estimate $1,415 to $1,515 | −7.4% | Oldest stock in the guide (median built 1949), with historic homes and small multifamily; typical value ~$249K vs. ~$1,265 rent (Highland Realty rent estimate $1,415 to $1,515). Values are down ~5% YoY and ~7% over 5 years; rental demand is strong, but the numbers fit flips and retail resale better than buy-and-hold. |
| 38105 | 28 | F | Medical District, Uptown, the Pinch, north Downtown edge | — | $107K | Data average $1,101 Highland Realty rent estimate $1,251 to $1,351 | +27.1% | Small zip (~5.5K residents), mostly apartments and infill, ~14% owner-occupied and ~24% vacant. Values are up ~27% over 5 years from a low base, but a very high reported crime rate makes it a specialist market. |
| 38106 | 36 | D | South Memphis, Soulsville, Riverside, Longview Heights, Glenview (part) | — | $55K | Data average $908 Highland Realty rent estimate $1,058 to $1,158 | +10.3% | 1950s small single-family homes at the lowest values in the guide (~$55K typical, ~$900 rent (Highland Realty rent estimate $1,058 to $1,158)). Paper yields are high, but vacancy is ~23%, values fell ~6% last year, and heavy rehab is common. |
| 38107 | 35 | D | North Memphis: Klondike, Smokey City, New Chicago, Hyde Park, west Vollintine-Evergreen | — | $104K | Data average $1,227 Highland Realty rent estimate $1,377 to $1,477 | +7.4% | Pre-1960 housing (median 1954); typical value ~$104K, ~17% vacancy. Values are up ~7% over 5 years but down ~4% last year. Expect heavy rehab and turnover risk. |
| 38108 | 50 | C | Nutbush, Hollywood, Chickasaw Heights, north Highland Heights | Yes | $67K | Data average $1,085 Highland Realty rent estimate $1,235 to $1,335 | +9.7% | 1950s single-family (78% SF) at ~$67K typical value with ~$1,085 Zillow rent (Highland Realty rent estimate $1,235 to $1,335): strong paper yield, but ~16% vacancy and high crime. Values are down ~4% YoY and up ~10% over 5 years; heavy-rehab inventory is common. |
| 38109 | 51 | C | Westwood, Whitehaven (west), Boxtown / Westhaven, Indian Hills | Yes | $88K | Data average $1,151 Highland Realty rent estimate $1,301 to $1,401 | +4.0% | Large, 87% single-family market of 1960s-era homes (~$88K typical, ~$1,150 rent (Highland Realty rent estimate $1,301 to $1,401)), majority owner-occupied (56%): a core cash-flow zip. Values are down ~7% YoY (+4% over 5 years); moderate rehab is typical. |
| 38111 | 47 | C | University District / U of M, Normal Station, Sherwood Forest, Chickasaw Gardens area, south Highland Heights | Yes | $131K | Data average $1,280 Highland Realty rent estimate $1,430 to $1,530 | +2.4% | Big, mixed zip (~42K residents) of 1950s homes around the University of Memphis; typical value ~$131K, rent ~$1,280 (Highland Realty rent estimate $1,430 to $1,530), ~11% vacancy. Values are flat over 5 years (+2%); crime varies sharply by block (sub-areas grade B- to F); moderate rehab on mid-century stock. |
| 38112 | 39 | D | Vollintine-Evergreen, Evergreen, Binghampton, Hein Park / Overton Park area, Crosstown (east) | Yes | $120K | Data average $1,233 Highland Realty rent estimate $1,383 to $1,483 | −4.3% | Old stock (median built 1950), ranging from historic Evergreen homes to distressed Binghampton houses, so medians disagree (Zillow ~$120K vs. Census ~$252K). Zillow shows values down ~8% YoY and ~4% over 5 years. Work it street by street and budget for older systems. |
| 38114 | 25 | F | Orange Mound, Castalia Heights, Glenview, Cherokee | — | $71K | Data average $929 Highland Realty rent estimate $1,079 to $1,179 | −5.0% | 1950s small homes at ~$71K typical value; ~23% vacancy and among the highest crime rates. Values are down ~7% YoY and ~5% over 5 years; heavy rehab and high holding risk. |
| 38115 | 34 | D | Hickory Hill (north), Fox Meadows, Ridgeway / Mt. Moriah corridor | Yes | $161K | Data average $1,029 Highland Realty rent estimate $1,179 to $1,279 | +11.4% | Apartment-heavy (32% single-family, 23% owner-occupied) 1980s-era stock; typical value ~$161K, rent ~$1,030 (Highland Realty rent estimate $1,179 to $1,279). Values are up ~11% over 5 years, but ~15% vacancy and high crime; the single-family streets are the opportunity. |
| 38116 | 32 | D | Whitehaven (east), Graceland area, airport south | — | $151K | Data average $928 Highland Realty rent estimate $1,078 to $1,178 | +9.2% | 1960s housing, ~$151K typical value, ~$930 rent (Highland Realty rent estimate $1,078 to $1,178) (apartment-weighted), ~16% vacancy. Values are up ~9% over 5 years; single-family pockets are steadier than the apartment corridors. |
| 38117 | 55 | B | East Memphis: White Station, Sea Isle, Red Acres, Colonial Acres, Poplar–Perkins | — | $264K | Data average $1,466 Highland Realty rent estimate $1,616 to $1,716 | +4.1% | Established 1950s single-family neighborhoods, 76% owner-occupied, ~$264K typical, ~$1,470 rent (Highland Realty rent estimate $1,616 to $1,716), ~5% vacancy. Crime is lower than in most Memphis zips (C+) but appreciation is slow (+4% over 5 years): stable rental demand, thin cash flow, light-to-moderate updates. |
| 38118 | 35 | D | Parkway Village, Oakhaven, Knight Arnold / Getwell, Airways south | Yes | $120K | Data average $1,178 Highland Realty rent estimate $1,328 to $1,428 | +8.6% | 1970s-era homes, ~$120K typical, ~$1,180 rent (Highland Realty rent estimate $1,328 to $1,428): a good rent-to-price ratio. But vacancy is ~19% (apartment-heavy pockets) and robbery and assault rates are high. Values are up ~9% over 5 years; moderate rehab is typical. |
| 38119 | 54 | B | Kirby, Balmoral, Ridgeway, Poplar–Kirby, River Oaks (part) | — | $288K | Data average $1,472 Highland Realty rent estimate $1,622 to $1,722 | +8.3% | 1970s homes plus condos and apartments (54% SF); ~$288K typical, ~$1,470 rent (Highland Realty rent estimate $1,622 to $1,722), ~6% vacancy. Crime grades C (better than most of the city) and values are up ~8% over 5 years: stable and low-maintenance, but yields are thin. |
| 38120 | 53 | B | River Oaks, Walnut Grove, Shady Grove, East Memphis Poplar corridor | — | $422K | Data average $1,563 Highland Realty rent estimate $1,713 to $1,813 | +7.7% | Upper-end East Memphis (~$422K typical), 72% owner-occupied, with one of the lower reported crime rates in the guide (72 per 1,000; B+). Gross yield is only ~4%: a quality, appreciation zip, not a cash-flow zip. |
| 38122 | 52* | C | Berclair, Highland Heights (east), Grahamwood, Summer Ave corridor | Yes | $121K | Data average $1,119 Highland Realty rent estimate $1,269 to $1,369 | +12.9% | 1950s single-family (77% SF), ~$121K typical, ~$1,120 rent (Highland Realty rent estimate $1,269 to $1,369), ~7% vacancy (low for this price band). Values are up ~13% over 5 years though down ~4% last year; moderate rehab on mid-century homes. |
| 38125 | 58 | B | Hickory Hill (south), Southwind, Riverdale, Windyke | — | $276K | Data average $1,516 Highland Realty rent estimate $1,666 to $1,766 | +13.7% | Newer suburban stock (median built 1996), ~$276K typical, ~$1,520 rent (Highland Realty rent estimate $1,666 to $1,766), ~5% vacancy; crime and schools both grade C- (better than most Memphis zips). Values are up ~14% over 5 years; light rehab; most homes are priced above the buy box. |
| 38126 | 37 | D | South City (former Foote Homes site), Vance Ave, LeMoyne-Owen area, south Downtown edge | — | $72K | Data average $787 (Census) Highland Realty rent estimate $937 to $1,037 | +33.8% | Small zip (~6K residents), mostly apartments and public-housing redevelopment, 12% owner-occupied, ~$72K typical value. It has the highest reported crime rate in the guide; values are up ~34% over 5 years from redevelopment, but there are few single-family rentals. |
| 38127 | 39 | D | Frayser, Rugby Hills, Shelby Forest area (part) | Yes | $87K | Data average $1,085 Highland Realty rent estimate $1,235 to $1,335 | +1.4% | Large 1960s single-family zip (77% SF), ~$87K typical with ~$1,085 rent (Highland Realty rent estimate $1,235 to $1,335) (strong paper yield), but ~18% vacancy and values down ~6% YoY (+1% over 5 years). Moderate-to-heavy rehab is common; underwrite street by street. |
| 38128 | 47 | C | Raleigh, Raleigh Springs / Austin Peay corridor, Coleman Rd area | Yes | $143K | Data average $1,198 Highland Realty rent estimate $1,348 to $1,448 | +14.7% | 1970s homes (63% SF), ~$143K typical, ~$1,200 rent (Highland Realty rent estimate $1,348 to $1,448). Values are up ~15% over 5 years (down ~2.5% YoY), the best 5-year trend among the buy-box zips; ~12% vacancy, moderate rehab. |
| 38133 | 62 | B | Bartlett (south), Wolfchase area (Memphis/Bartlett addresses) | — | $271K | Data average $1,648 Highland Realty rent estimate $1,798 to $1,898 | +15.2% | 1990s suburban single-family, ~$271K typical, ~$1,650 rent (Highland Realty rent estimate $1,798 to $1,898), ~4% vacancy, B+ crime and schools. Values are up ~15% over 5 years; light rehab and reliable rental demand; priced above the buy box. |
| 38134 | 56 | B | Raleigh (east), Bartlett (south), Elmore Park, Shelby Oaks | — | $223K | Data average $1,206 Highland Realty rent estimate $1,356 to $1,456 | +17.6% | 1979-median homes, ~$223K typical, ~$1,200 rent (Highland Realty rent estimate $1,356 to $1,456), ~5% vacancy, C- crime. Values are up ~18% over 5 years (the best non-redevelopment trend in the guide) and +1% YoY; light-to-moderate rehab. |
| 38135 | 71 | A | Bartlett (north), Ellendale, Raleigh–LaGrange | — | $295K | Data average $1,799 Highland Realty rent estimate $1,949 to $2,049 | +15.5% | 1990s single-family (92% SF), ~$295K typical, ~$1,800 rent (Highland Realty rent estimate $1,949 to $2,049), ~2% vacancy, A- crime, B schools, values up ~16% over 5 years. Top-tier stability with light rehab, but well above buy-box prices. |
| 38138 | 66 | A | Germantown (west / central): separate city with its own police and codes | — | $429K | Data average $2,259 Highland Realty rent estimate $2,409 to $2,509 | +11.8% | Premium suburb: ~$429K typical, ~$2,260 rent (Highland Realty rent estimate $2,409 to $2,509), ~4% vacancy, A crime and A schools, values up ~12% over 5 years. Appreciation and rental demand are strong; cash flow is thin. |
| 38139 | 71 | A | Germantown (east), Forest Hill / Shelby Farms south edge | — | $585K | Data average $2,697 (Census) Highland Realty rent estimate $2,847 to $2,947 | +14.2% | Highest values in the guide (~$585K), 97% owner-occupied, A crime, A+ schools, very few rentals (rent figure is Census, approximate: data average $2,697 (Census), Highland Realty rent estimate $2,847 to $2,947). An appreciation-only market. |
| 38141 | 63 | B | Hickory Hill (south), Ridgeway–Hacks Cross, Shelby Drive area | — | $188K | Data average $1,570 Highland Realty rent estimate $1,720 to $1,820 | +13.5% | 1985-median homes, 85% single-family, ~$188K typical, ~$1,570 rent (Highland Realty rent estimate $1,720 to $1,820), ~3% vacancy, values up ~14% over 5 years. Crime grades F nationally but the rate (82 per 1,000) is well below most Memphis zips; light-to-moderate rehab. |
| 38016 | 55 | B | Cordova (north): Germantown Pkwy / Wolfchase | — | $290K | Data average $1,495 Highland Realty rent estimate $1,645 to $1,745 | +9.8% | Newer stock (1998 median), ~$290K typical, ~$1,500 rent (Highland Realty rent estimate $1,645 to $1,745), B- crime; ~8% vacancy (apartment-heavy pockets). Values are up ~10% over 5 years; light rehab. |
| 38018 | 60 | B | Cordova (south), Shelby Farms east | — | $287K | Data average $1,658 Highland Realty rent estimate $1,808 to $1,908 | +9.5% | 1997-median homes, ~$287K typical, ~$1,660 rent (Highland Realty rent estimate $1,808 to $1,908), ~5% vacancy, B- crime. Values are up ~10% over 5 years; light rehab. |
Vacancy and owner-occupancy are Census ACS 2020–2024. Vouchers are approximate (HUD, allocated by land-area overlap) and are shown for rental-demand context only; they are not in the score. Crime is reported crimes per 1,000 residents (CrimeGrade, November 2026). School figures are SchoolGrade via CrimeGrade and are not in the score.
Swipe the table to see all columns.
| Zip | Grade | Vacancy | Owner-occ. | Single-family | Median yr built | Rehab (inferred) | Vouchers / 100 rentals | Crimes / 1,000 | Schools |
|---|---|---|---|---|---|---|---|---|---|
| 38103 | F | 10% | 32% | 19% | 1999 | Light | 6.5 | 216 / F | F / 23% |
| 38104 | F | 11% | 38% | 37% | 1949 | Moderate | 2.1 | 185 / F | D / 30% |
| 38105 | F | 24% | 14% | 20% | 1970 | Moderate | 24.1 | 251 / F | F / 21% |
| 38106 | D | 23% | 39% | 79% | 1954 | Heavy | 9.7 | 248 / F | F / 14% |
| 38107 | D | 17% | 38% | 63% | 1954 | Heavy | 9.0 | 216 / F | F / 23% |
| 38108 | C | 16% | 46% | 78% | 1956 | Heavy | 6.3 | 186 / F | F / 23% |
| 38109 | C | 12% | 56% | 87% | 1964 | Moderate | 12.3 | 153 / F | F / 20% |
| 38111 | C | 11% | 44% | 65% | 1956 | Moderate | 4.2 | 128 / F | D− / 27% |
| 38112 | D | 13% | 52% | 63% | 1950 | Moderate | 3.6 | 172 / F | D− / 26% |
| 38114 | F | 23% | 46% | 65% | 1955 | Heavy | 8.9 | 248 / F | F / 23% |
| 38115 | D | 15% | 23% | 32% | 1981 | Light | 3.4 | 167 / F | F / 25% |
| 38116 | D | 16% | 43% | 46% | 1966 | Moderate | 5.8 | 184 / F | F / 24% |
| 38117 | B | 5% | 76% | 82% | 1958 | Light–moderate | 1.6 | 86 / C+ | D− / 28% |
| 38118 | D | 19% | 40% | 57% | 1973 | Moderate | 5.9 | 187 / F | F / 20% |
| 38119 | B | 6% | 60% | 54% | 1979 | Light–moderate | 0.7 | 77 / C | D / 29% |
| 38120 | B | 6% | 72% | 75% | 1976 | Light–moderate | 0.0 | 72 / B+ | B+ / 45% |
| 38122 | C | 7% | 53% | 77% | 1956 | Moderate | 1.6 | 147 / F | D / 32% |
| 38125 | B | 5% | 54% | 66% | 1996 | Light | 2.2 | 65 / C− | C− / 39% |
| 38126 | D | 14% | 12% | 29% | 1979 | Moderate | 22.1 | 265 / F | F / 20% |
| 38127 | D | 18% | 42% | 77% | 1966 | Moderate–heavy | 10.4 | 177 / F | F / 23% |
| 38128 | C | 12% | 42% | 63% | 1975 | Moderate | 6.4 | 138 / F | F / 22% |
| 38133 | B | 4% | 68% | 81% | 1993 | Light | 1.6 | 66 / B+ | B+ / 45% |
| 38134 | B | 5% | 47% | 58% | 1979 | Light–moderate | 1.6 | 88 / C− | C / 36% |
| 38135 | A | 2% | 81% | 92% | 1993 | Light | 2.3 | 25 / A− | B / 44% |
| 38138 | A | 4% | 80% | 76% | 1979 | Light–moderate | 0.3 | 32 / A | A / 52% |
| 38139 | A | 2% | 97% | 97% | 1989 | Light | 0.0 | 15 / A | A+ / 63% |
| 38141 | B | 3% | 56% | 85% | 1985 | Light–moderate | 6.1 | 82 / F | F / 20% |
| 38016 | B | 8% | 55% | 58% | 1998 | Light | 0.3 | 57 / B− | D / 33% |
| 38018 | B | 5% | 62% | 79% | 1997 | Light | 0.3 | 51 / B− | D+ / 34% |
FAQ
We use available data on properties that have been bought and sold nearby, plus our best judgment from historical experience. Treat our numbers as a starting point, and get verifications from a trusted contractor like our partner, Red Rock Construction. Home Run is all-in under 65% of ARV; Sweet Spot is 65% to under 80%.
Absolutely. We’re happy to look at any deal, on a deal-by-deal basis. Send us what you have.
From investors we work with, plus public sources like the U.S. Census, Zillow, and crime and school rating sites. The full list is at the bottom of this page.
The guide is updated periodically as the data changes. Figures are estimates as of the date at the top of this page, and they can change.
Yes. Highland Realty Services also manages properties for investors after you buy. See our property management page, or talk to us.
Join the list on our Talk to us page, or manage your choices on Contact preferences. We send a Hot Deal email when a new deal drops.
Limits
Sources